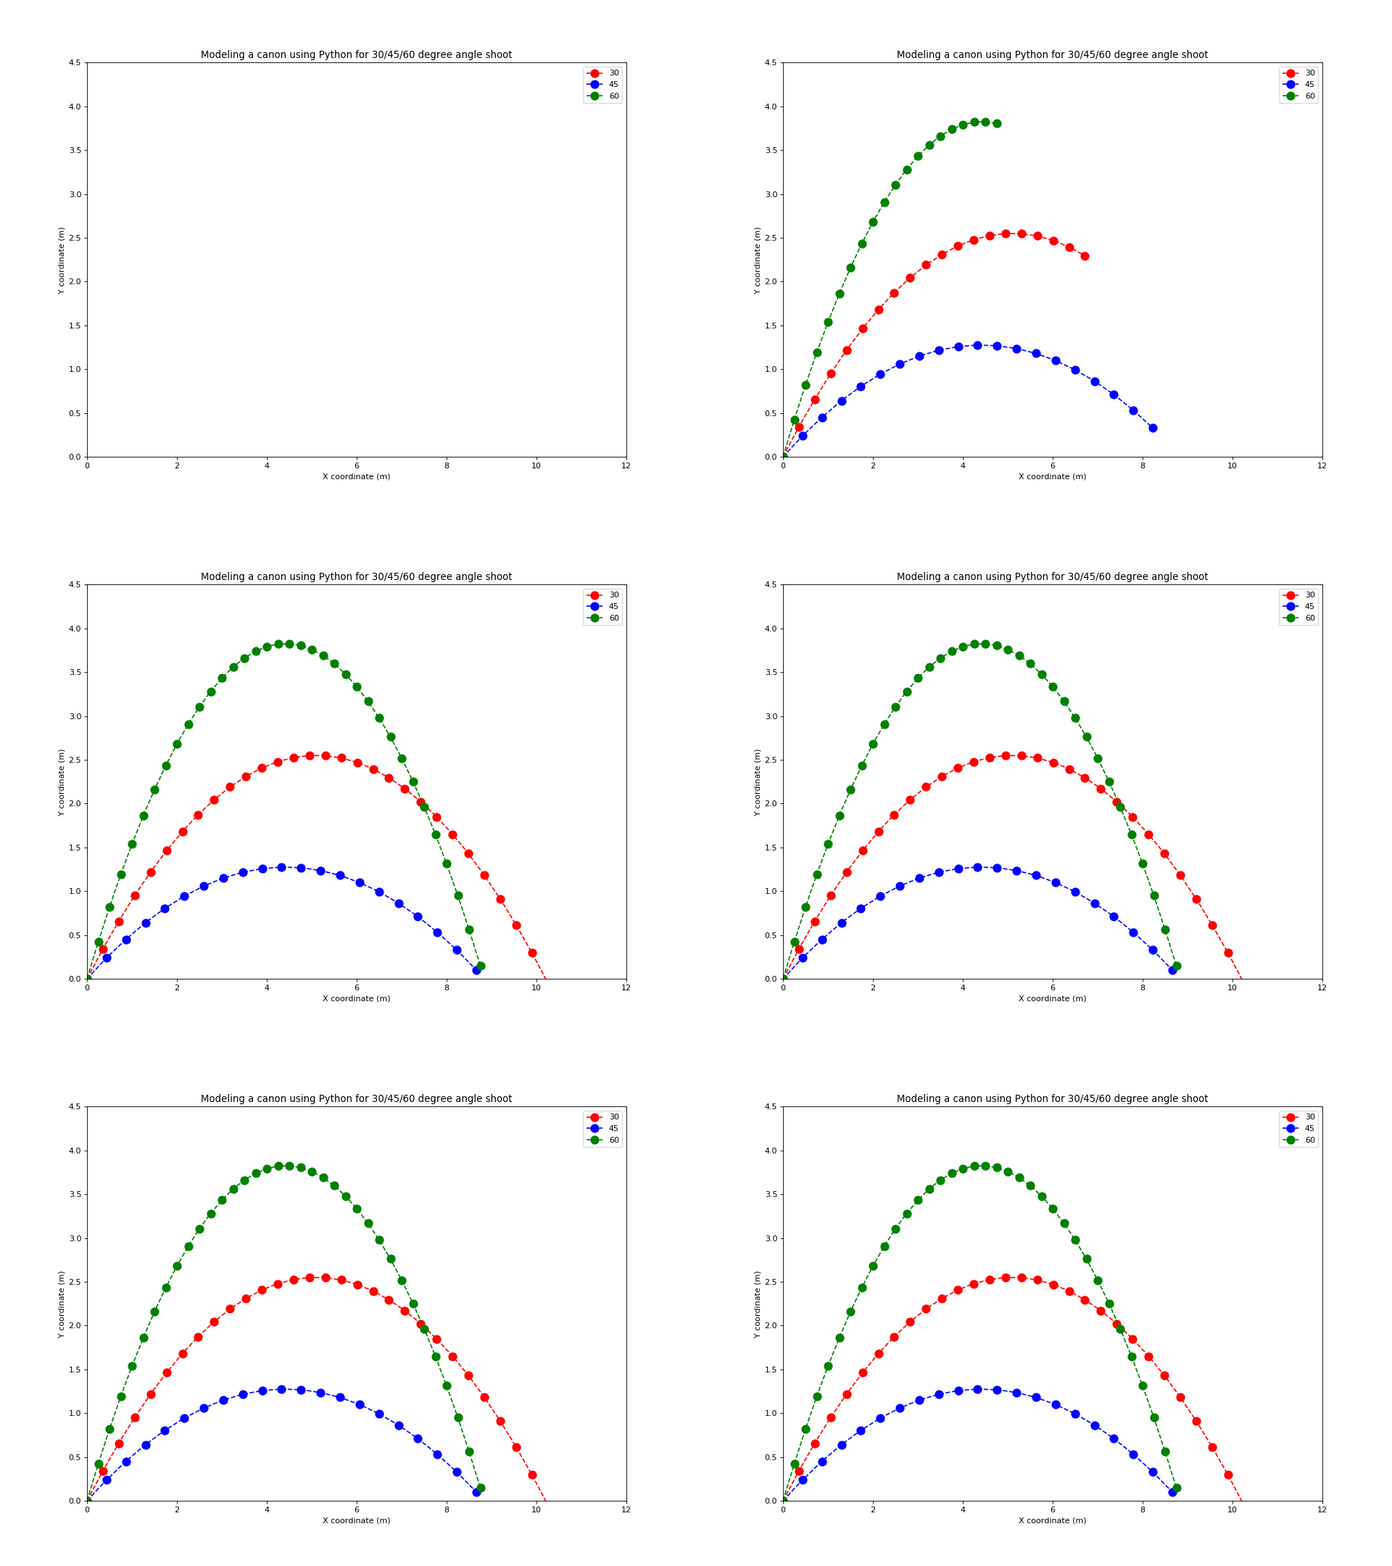
Modeling a cannon using Python
Let us model a cannon using Python: given the same initial speed, how to hit a target in a given position with a cannon? Let the cannon be placed in the origin, i.e. its initial coordinate is (0,0) and the rest of parameters are:
\[\begin{cases} x_0 = 0 \text{ meters}\\ y_0 = 0 \text{ meters}\\ t = 30 \text{ seconds} \\ v_0 = 10 m/s \\ g = -10 m/s^2 \\ \theta = 30,45,60 \end{cases}\]Suppose a cannon can fire a bullet with the initial velocity \(v_{0}\) from the horizon. What is the best shooting angle \(\theta\) that will fire the cannon bullet furthest ? As the bullet’s motion is determined by initial speed, angle and gravity. The two dimensional kinematic formula gives us all equations needed:
\[\begin{cases} v_{x0} = v_0 \cos\theta \\ v_{y0} = v_0 \sin\theta \\ x_1 =x_0 + v_{x0} t \\ y_1 =y_0 + v_{y0} t + \frac{1}{2}gt ^2 \end{cases}\]Copy the code below, open the Python Playground, paste the code and run it.
1
2
3
4
5
6
7
8
9
10
11
12
13
14
15
16
17
18
19
20
21
22
23
24
25
26
27
28
29
30
31
32
33
34
35
36
37
38
39
40
41
42
43
from math import sin, cos, radians
from matplotlib import pyplot as plt

# Returns two lists of x and y coordinates for each time in tlist
def shoot(x0, y0, velocity, angle, tlist):
  #initial speed and acceleration
  vx = velocity * cos(radians(angle))
  vy = velocity * sin(radians(angle))
  g  = 9.8

  #coordinate list for each time in tlist
  xlist = []
  ylist = []

  for t in tlist:
    x1 = x0 + vx * t
    y1 = y0 + vy * t - .5*g*t**2

    # append to the coordinates if it is still above ground
    if y1 >=0:
      xlist.append(x1)
      ylist.append(y1)

  return xlist, ylist

#generate a time list with 0.05 seconds a part
tlist = [x*0.05  for x in range(50)]

x0 = 0
y0 = 0
velocity = 10

x45, y45 = shoot(x0, y0, velocity, 30, tlist)
x30, y30 = shoot(x0, y0, velocity, 45, tlist)
x60, y60 = shoot(x0, y0, velocity, 60, tlist)

plt.title('Modeling a cannon using Python for 45/30/60 degree shoott')
plt.plot(x45, y45, 'bo-', x30, y30, 'ro-', x60, y60, 'ko-',
        [0, 12], [0, 0], 'k-',  markersize=3,linestyle='dashed'
        )
plt.xlabel('X coordinate (m)')
plt.ylabel('Y coordinate (m)')
plt.show()
